How to Read Crypto Trading Charts: A Beginner’s Guide to Price Action, Candlesticks, and Volume
 Dec, 5 2025
Volume Confirmation Checker
Check if price movements are confirmed by volume - a key indicator that moves are likely to continue. Based on data showing 76% of Bitcoin rallies with volume spikes above 35% of the 20-period average.
Reading crypto trading charts isn’t about guessing the future-it’s about spotting patterns that have happened before and understanding what they mean right now. If you’ve ever stared at a chart with green and red candles, volume bars, and lines flying everywhere, wondering what it all means, you’re not alone. Most new traders lose money not because they’re bad at math, but because they don’t know how to read the story the chart is telling.
What You’re Actually Looking At
Crypto trading charts are graphs that show how the price of a cryptocurrency has moved over time. Unlike stocks, crypto markets never sleep. Prices change every second, 24/7. That means the data on your chart is always moving, always fresh. The most common type of chart you’ll see is the candlestick chart. It’s called that because each candle looks like a tiny candle with a body and wicks. Each candle represents a specific time period-like 1 minute, 1 hour, or 1 day. Inside each candle, you see four key numbers:- Open: The price when the period started
- Close: The price when the period ended
- High: The highest price reached during that period
- Low: The lowest price reached during that period
Timeframes Matter More Than You Think
One of the biggest mistakes beginners make is trading on the wrong timeframe. You might see a 5-minute chart and think you’re being fast and sharp. But 5-minute charts are noisy. They’re full of false signals-price spikes that mean nothing in the bigger picture. Most successful traders start with the daily chart. Why? Because it filters out the noise. It shows you the real trend. If the daily chart is going up, then even if the 1-hour chart dips for a few hours, the overall direction is still bullish. Think of it like driving a car. You don’t stare at the speedometer every second-you look ahead at the road. Here’s what most pros use:- Daily chart: To see the big trend (what you should trade)
- 4-hour chart: To find good entry points
- 1-hour or 15-minute chart: To time your exact buy or sell
Volume: The Secret Weapon Most Beginners Ignore
Price doesn’t move on its own. Someone has to buy or sell it. Volume tells you who’s in control. Volume bars sit below the price chart. Green bars mean the price closed higher that period. Red bars mean it closed lower. But here’s the key: volume confirms the move. If the price rises on low volume, it’s weak. It could be a fake-out. If the price rises on high volume-especially if it’s 50% or more above the average-you’re seeing real demand. In 2024, over 76% of sustained Bitcoin rallies happened when volume spiked above 35% of the 20-period average. That’s not luck. That’s evidence. Watch for volume spikes during breakouts. If a coin breaks above a resistance level with heavy volume, it’s likely to keep going. If it breaks with low volume? It’ll probably fall back. That’s why so many people lose money-they buy on breakout candles without checking volume.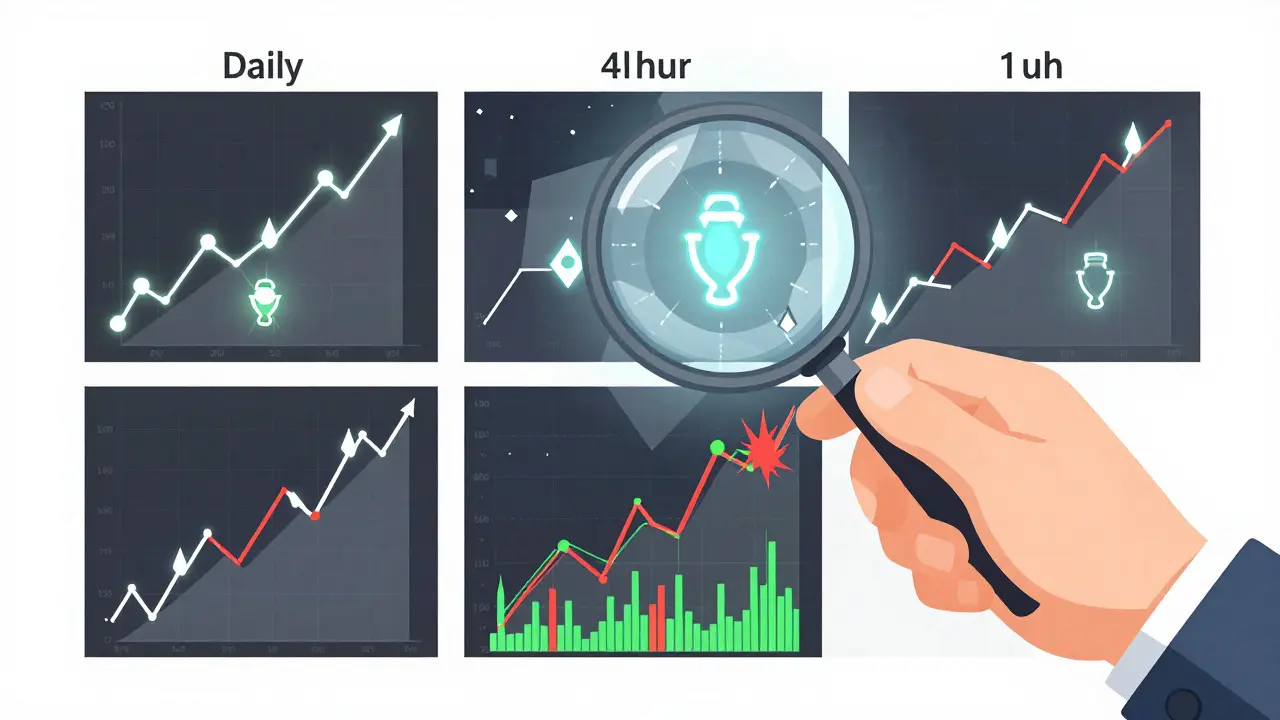
Candlestick Patterns That Actually Work
Candlesticks aren’t just pretty shapes. They tell stories. Here are two patterns that show up often and have real predictive power:- Bullish Engulfing: A small red candle, then a larger green candle that completely covers it. This means sellers lost control. Buyers stepped in hard. In 2024, this pattern had a 73.6% success rate in predicting reversals across Bitcoin, Ethereum, and top altcoins.
- Cup and Handle: Looks like a coffee cup with a handle. The cup is a U-shaped bottom. The handle is a small pullback after the cup forms. When price breaks above the handle’s high, it often rockets higher. Traders using this pattern on Bitcoin during the 2024 halving cycle saw returns over 300%.
What Not to Do
Here’s what kills new traders:- Using too many indicators: RSI, MACD, Stochastic, Bollinger Bands-putting them all on one chart is like listening to 10 people talk at once. You’ll get confused. Start with price and volume only.
- Trading low-liquidity coins: If a coin trades less than $5 million a day, it’s easy for one big player to manipulate the price. Patterns fail here. Stick to Bitcoin, Ethereum, and top 20 coins with high volume.
- Ignoring the bigger picture: If your 1-hour chart shows a bullish pattern, but the daily chart is crashing? Don’t buy. The trend is your friend.

How to Practice Without Losing Money
You don’t need to risk your savings to learn. Here’s a simple 4-step plan:- Weeks 1-2: Open TradingView (free version works). Look only at Bitcoin’s daily chart. Identify the trend. Is it going up, down, or sideways? Don’t trade. Just observe.
- Weeks 3-5: Start spotting candlestick patterns. Write down every Bullish Engulfing or Cup and Handle you see. Note what happened next. Did price go up? How long did it take?
- Weeks 6-8: Add volume. Check if the pattern happened on high volume. Compare winning trades to losing ones. You’ll start seeing a pattern in the patterns.
- Week 9+: Try paper trading. Use TradingView’s simulated trading feature. Place fake trades based on what you’ve learned. Track your win rate.
Tools You Actually Need
You don’t need fancy software. Here’s what works:- TradingView: Used by 78% of professional crypto traders. Free version gives you candlesticks, volume, and 3 indicators. Perfect for beginners.
- Coinbase or Binance: Both have basic charting tools. Use them to confirm what you see on TradingView.
- Reddit’s r/CryptoMarkets: Real traders post charts and ask for feedback. Look for posts with 1,000+ upvotes. See what patterns others are spotting.
What’s Next for Crypto Charts
The future of charting is getting smarter. Platforms are now adding real-time order book heatmaps-showing where big buyers and sellers are clustered. AI is starting to flag patterns automatically. But here’s the truth: no algorithm replaces your judgment. The best traders don’t rely on AI. They use it as a filter. They still look at the chart, read the volume, and decide for themselves. That’s why technical analysis will stay relevant for years. Even as on-chain data and AI models grow, price action will always be the heartbeat of the market.What’s the best chart type for beginners?
The candlestick chart is the best for beginners because it shows all the key price data-open, close, high, and low-in one simple visual. Line charts are easier but hide too much detail. Candlesticks give you the full story without overwhelming you.
Do I need to pay for TradingView?
No. TradingView’s free plan has everything you need to learn: candlestick charts, volume bars, and basic drawing tools. You can’t save more than 3 indicators at once, but that’s actually helpful-it keeps you focused. Paying $14.95/month only becomes worth it when you’re trading daily and want advanced alerts or more indicators.
Why does my green candle sometimes mean the price went down?
It doesn’t. A green candle always means the closing price was higher than the opening price for that time period. But if the previous candle was green and this one is also green but smaller, the trend might be weakening. People confuse the color with the overall direction. Always compare the current candle to the one before it.
Can I trust candlestick patterns in crypto?
Yes-but only when confirmed. Patterns like Bullish Engulfing or Cup and Handle work about 70% of the time in major cryptocurrencies like Bitcoin and Ethereum. But in low-volume altcoins, they fail more often because of manipulation. Always check volume and the daily trend before acting.
How long does it take to get good at reading charts?
Most people see real improvement in 6-8 weeks if they practice daily. Spend 15 minutes a day looking at Bitcoin’s daily chart. Identify trends, spot patterns, check volume. Don’t trade real money until you’ve correctly predicted 10 moves in a row on paper. Skill comes from repetition, not shortcuts.
Tara Marshall
December 6, 2025 AT 04:44Candlestick charts are the only way to go. Volume confirms everything. No indicators needed. Just price and volume. Everything else is noise.
Watch the daily. Then zoom in. Simple.
Done.
Richard T
December 7, 2025 AT 03:20I used to overcomplicate this too. Thought I needed 10 indicators. Turned out I just needed to stop trading every tiny dip.
Started with Bitcoin daily, watched for engulfing patterns with volume spikes. Took me 3 weeks to stop chasing.
Now I wait. And when the setup shows up? I move. No stress. No FOMO.
Same pattern works on ETH too. Just slower.
jonathan dunlow
December 7, 2025 AT 06:51Y’ALL NEED TO STOP DOING THIS. I’ve been trading crypto since 2017 and let me tell you - this is the single most important thing I’ve ever learned. You think you’re being smart by jumping on a 5-minute breakout? Nah. You’re just feeding the whales.
Look at the daily. If it’s green and volume’s up? That’s your lane. If it’s red and nobody’s buying? Step back. Breathe.
I used to lose 3K a month. Now I make 15K a quarter. Why? Because I stopped trying to be a day trader and started being a trend follower.
Practice for 15 minutes a day. Not 2 hours. Not 10 charts. One chart. Bitcoin. Daily. That’s it.
Do that for 6 weeks. Then paper trade. Then go live. You’ll thank me in 2025.
And no - you don’t need TradingView Pro. Free works fine. I’ve made more on free than most people do on paid.
Stop wasting money on bots. Stop chasing signals. Just watch the candles. The market is talking. Are you listening?
Mariam Almatrook
December 8, 2025 AT 13:00One must question the epistemological foundations of price action theory in the context of decentralized, non-regulated asset classes. The very notion that historical candlestick formations possess predictive validity assumes a level of market rationality that is demonstrably absent in crypto ecosystems, wherein liquidity manipulation and whale-driven pump-and-dumps constitute systemic normativity.
Furthermore, to privilege Bitcoin as a benchmark is to implicitly endorse a hegemonic monetary paradigm - one that replicates the very centralization mechanisms crypto purportedly sought to dismantle.
One must ask: if the market is fundamentally irrational, how can any technical construct, no matter how empirically validated, claim epistemic authority?
Perhaps the true ‘edge’ lies not in reading charts, but in recognizing their futility.
rita linda
December 8, 2025 AT 19:18Most of you are still trading altcoins like it’s 2021. That’s why you’re broke. If you’re not trading BTC or ETH, you’re gambling. Period.
Volume under $5M? That’s not trading - that’s a casino rigged by dev teams.
And if you’re using RSI or MACD? You’re not a trader. You’re a bot. A useless, overcomplicated bot.
Bitcoin daily. Volume. Engulfing. That’s the entire playbook. Everything else is for people who don’t want to learn.
Stop blaming the market. You’re just lazy.
Brooke Schmalbach
December 10, 2025 AT 14:51Let’s be real - 73.6% success rate? That’s cherry-picked data. You’re ignoring the 26.4% of times Bullish Engulfing turned into a trap.
And Cup and Handle? That’s a pattern that works in textbooks. In crypto? It’s a meme. Look at the last 10 times it showed up on Solana. Half were fakeouts.
Also, why are we still talking about TradingView? The real pros are using on-chain metrics now - MVRV, NUPL, SOPR. Price action is dead.
You’re all stuck in 2020. The game changed.
Sandra Lee Beagan
December 11, 2025 AT 11:25I learned this in Vancouver last year - same way. Daily chart. Just Bitcoin. Took me two months to stop checking my phone every 5 minutes.
One thing I’ll add - when you see a volume spike on a breakout, don’t just buy. Wait for the retest.
Most people buy the breakout. The smart ones wait for the pullback to the breakout level. That’s where the real money is.
And yes, TradingView free works. I’ve never paid. I just bookmark 3 charts and check them every morning with my tea.
Peace.
☕
sonia sifflet
December 12, 2025 AT 07:35Everyone here is so naive. You think patterns work because you saw it once? In India, we call this ‘chance masquerading as skill’. The market is manipulated by whales who control 60% of BTC supply. Your ‘bullish engulfing’? It’s a trap set by a wallet with 10K BTC.
Stop pretending this is a game of skill. It’s a casino with a fancy interface.
And if you think you can beat this with ‘practice’ - you’re the next one who’ll lose everything.
Just buy and HODL. That’s the only real strategy.
Thomas Downey
December 13, 2025 AT 06:04It is deeply concerning that this post, while technically accurate, perpetuates the myth that retail participants can meaningfully compete in a market dominated by institutional actors wielding superior infrastructure, data access, and capital.
Furthermore, the glorification of candlestick analysis as a ‘skill’ is a form of epistemic violence - it misleads the uninformed into believing that mastery of archaic visual constructs can yield sustainable alpha.
One must ask: if the market is fundamentally asymmetric, why are we encouraging the vulnerable to engage in a rigged system under the guise of education?
Perhaps the most ethical act is to abstain entirely.
Annette LeRoux
December 14, 2025 AT 20:50I love how this post feels like a quiet conversation with someone who’s been there.
It’s not about winning every trade. It’s about learning to listen.
Like when you sit by a river and stop trying to control the current - you just notice where the water flows, where it swirls, where it pauses.
That’s what charts are. Not predictions. Just echoes of what people did.
And volume? That’s the sound of their footsteps.
Keep it simple. Stay curious. Don’t rush.
❤️
Jerry Perisho
December 16, 2025 AT 18:59One thing people miss - volume isn’t just about size. It’s about consistency.
Look at the 20-period average. If a spike is 35% above it, that’s meaningful.
But if it’s a one-off spike on a 15-min chart? Ignore it.
Wait for it to happen on the 4-hour or daily. That’s when you know it’s real.
Also - don’t trade on weekends. Volume drops 70%. Patterns lie.
Simple. Clean. Works.
Manish Yadav
December 17, 2025 AT 23:50You people are all idiots. This is not a game. You think you can learn this from a blog? You’ll lose your rent money. Crypto is a scam. The only winners are the ones who created it. Everyone else is just feeding them.
Stop reading charts. Stop trading. Just buy BTC and shut up.
That’s the only way to win.
ronald dayrit
December 19, 2025 AT 06:00There’s something deeply poetic about price action - the way it moves, the rhythm of it, the silence between the candles. It’s not just data. It’s the collective heartbeat of thousands of strangers, all trying to make sense of chaos.
When I look at a daily chart, I don’t see green and red. I see stories - fear, greed, patience, desperation.
That one bullish engulfing pattern? It’s not a signal. It’s a moment of collective realization - a thousand traders, in a thousand time zones, deciding at once: ‘Maybe this is it.’
And volume? That’s the sound of belief crystallizing into action.
It’s not a tool. It’s a mirror.
And the market? It doesn’t care if you understand it.
It just keeps moving.
So you learn to move with it - not against it.
Not because you’re smart.
But because you’ve learned to listen.