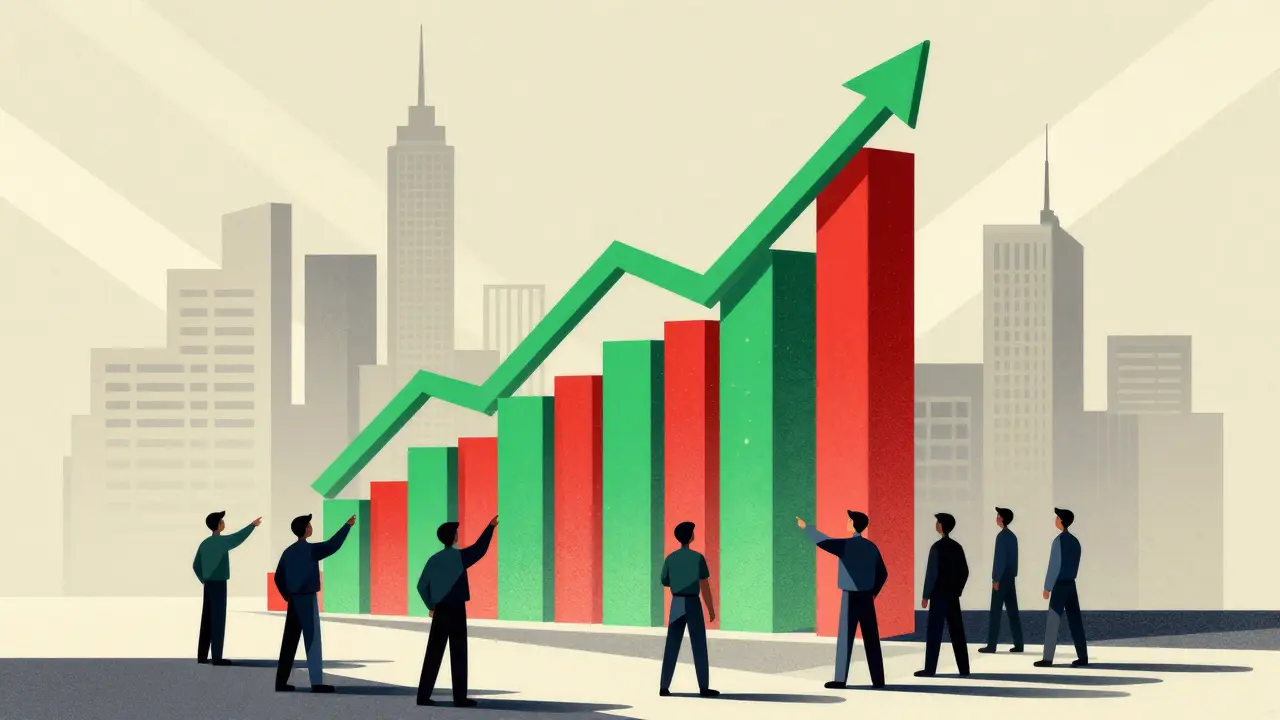
Learn how to read crypto trading charts with candlesticks, volume, and timeframes. Avoid common mistakes and start making smarter trades based on real price action-not guesses.
When people talk about crypto technical analysis, the practice of using price charts and historical data to predict future price movements in digital assets. Also known as chart analysis, it’s the go-to tool for traders who don’t rely on news or hype. But here’s the truth: most beginners treat it like a crystal ball. They chase candlestick patterns they saw on TikTok, stack indicators on top of each other, and wonder why they keep losing money. The reality? Technical analysis isn’t about guessing—it’s about reading probability, managing risk, and staying disciplined.
It’s not magic. It’s a system built on chart patterns, repeating price structures like head and shoulders, triangles, or double tops that signal potential reversals or continuations. These patterns work because human behavior doesn’t change—fear and greed show up the same way in Bitcoin charts as they did in 1920s stock markets. Then there’s trading indicators, mathematical calculations like RSI, MACD, or moving averages that help filter noise and spot momentum shifts. But here’s the catch: no indicator works alone. Using five at once doesn’t make you smarter—it makes you slower. The best traders use one or two, understand their limits, and never let them make decisions for them.
And then there’s price action, the raw movement of price without indicators—what the candles are actually doing on the chart. This is where the real edge lives. It’s not about spotting a bullish engulfing pattern on a 5-minute chart. It’s about asking: Is volume rising with the move? Are big players accumulating or dumping? Are we seeing rejection at key levels? These are the questions that separate traders from gamblers.
What you won’t find in most guides is how often technical analysis fails. Crypto markets are wild. A single tweet, a regulatory rumor, or a whale moving 500 BTC can wipe out a perfectly set up trade in seconds. That’s why technical analysis only works when it’s paired with solid risk management—never risking more than 1-2% per trade, always having an exit plan, and walking away when the market doesn’t make sense.
Look at the posts below. You’ll see real examples of what happens when people ignore this. CoinCasso, OPNX, Paycml—these weren’t just scams. They were distractions. People got caught up in hype, ignored the charts, and trusted promises instead of patterns. Meanwhile, projects like Bancor Network and Elk Finance? They didn’t promise moonshots. They showed how liquidity, trading volume, and real usage shape price behavior over time. That’s the kind of insight technical analysis can give you—if you’re willing to learn it properly.
What follows isn’t a list of magical signals or secret indicators. It’s a collection of real stories—what worked, what blew up, and what you can learn from both. No fluff. No hype. Just what you need to know to read the charts without getting fooled by them.
Learn how to read crypto trading charts with candlesticks, volume, and timeframes. Avoid common mistakes and start making smarter trades based on real price action-not guesses.